

New York achieved something remarkable in 2025. Traffic fatalities dropped to their lowest level in over a century, tying with the safest year on record since 1910. The state recorded 206 deaths, an 18 percent decrease from 2024 and the largest single-year improvement in more than two decades.
But that achievement tells only part of the story. Four New Yorkers still died in traffic crashes every week on average throughout 2025. Thousands more suffered serious injuries that changed their lives permanently. And when you examine where these crashes happened, a troubling pattern emerges. Certain neighborhoods, specific intersections, and particular road corridors continue to see injuries pile up year after year, even as other areas have become dramatically safer.
Prior results do not guarantee a similar outcome.
Infrastructure design, maintenance decisions, and the presence or absence of proven safety measures directly determine who gets hurt and where. Some neighborhoods have benefited from street redesigns, protected bike lanes, and speed cameras. Others have been left waiting for improvements that never come, watching injuries accumulate while proposed safety projects sit stalled or abandoned.
This report examines the data from 2025 to answer a straightforward question: where are people actually getting hurt in New York car accidents?
How Many People Died in New York Traffic Crashes During 2025?
The 206 traffic deaths in 2025 broke down into distinct categories that reveal who faces the greatest danger on New York roads:
- Pedestrians: 112 deaths
- Motorists: 73 deaths
- Cyclists: 21 deaths
These proportions matter because they show that in an urban state like New York, the people outside of vehicles face disproportionate risk.
The injury data extends far beyond fatalities. Thousands of New Yorkers suffered serious injuries in 2025 that required hospitalization, caused permanent disability, or resulted in months of recovery. These serious injuries, tracked through emergency department data and crash reports, concentrate in predictable patterns across specific geographic areas.
What makes the 2025 data particularly significant is the uneven distribution of progress. Some boroughs saw dramatic improvements while others barely changed or actually got worse. The Bronx experienced a 38 percent decline in traffic fatalities compared to 2024, saving 20 lives in a single year. Queens saw fatalities decrease by 22 percent, saving 16 lives. Brooklyn and Manhattan had more modest improvements, with 7 percent and 14 percent declines respectively. Staten Island was the only borough where traffic deaths actually increased, with one additional fatality representing an 8 percent rise.
These borough-level differences reflect more than statistical variation. They represent real differences in how safety resources have been deployed, which streets have received infrastructure improvements, and where proven safety measures like speed cameras have been installed at scale.
Where Are the Most Dangerous Intersections in New York?
Certain specific locations in New York have emerged as persistent danger zones where injuries accumulate year after year.
Northern Boulevard at 48th Street in Queens holds the grim distinction of being the deadliest intersection across all five boroughs. Between January 2022 and 2025, nine people were killed or seriously injured at this single location.
What makes this intersection so dangerous? The combination of highway-like traffic volumes, complex sight lines, high vehicle speeds, and multiple conflict points where vehicles turning or crossing paths create opportunities for severe collisions. Drivers treating Northern Boulevard like a highway rather than an urban street contribute to speeds that leave pedestrians and other road users with little margin for error. The intersection’s design creates situations where people trying to cross legally face vehicles approaching from multiple directions at speeds that make stopping difficult.
But this particular street is not an isolated problem. Queens Boulevard, despite years of safety improvement efforts, continues to see serious crashes. The Long Island Expressway maintains crash rates that reflect the dangerous combination of speed and traffic volume characteristic of major throughways. Throughout Queens, numerous intersections present elevated risks that data has identified but that have not yet received comprehensive safety interventions.
Third Avenue in Sunset Park Brooklyn also stands out as particularly troubling. Between 2024 and early 2026, eleven people were killed or seriously injured on a 2.4-mile stretch of Third Avenue between 15th Street and 65th Street. What makes this corridor especially frustrating is that a comprehensive redesign had been proposed to address exactly these dangers. The plan included protected bike lanes and lane reductions designed to calm traffic. But the project was stalled, and while it sat in limbo, the crashes continued.
Just one block away, on Fourth Avenue, a different story unfolded. After the Department of Transportation installed a comprehensive safety redesign, pedestrian injuries dropped by 29 percent. That stark contrast between Fourth Avenue’s improved safety and Third Avenue’s continued danger demonstrates something important. The geographic distribution of injuries is not inevitable or unchangeable. It reflects infrastructure decisions. Where safety measures get implemented, injuries decline. Where proposed improvements get postponed or abandoned, injuries continue to accumulate.
Fordham Road between 10th Avenue in Manhattan and White Plains Road in the Bronx presents another example of how delayed safety improvements translate directly into human harm. Since September 2023, when a proposed busway and bus lane project was paused, thirty-five people were killed or seriously injured along this corridor. Buses continue to crawl at speeds under five miles per hour despite this being a major transit route, while the congestion and complex traffic patterns create dangerous conditions for everyone using the road.
Which Roads Outside New York City See the Most Serious Crashes?
The Taconic State Parkway in Westchester County has earned the unfortunate distinction of having the highest number of fatalities of any road in New York State history.
Running 104 miles between the Kensico Dam Plaza in Westchester County and Chatham in Columbia County, the Taconic presents dangers that stem from its design characteristics. The parkway features narrow, winding roadways with limited forgiving margins. When crashes occur at parkway speeds, they frequently result in serious injuries or fatalities. Between July 2011 and July 2014 alone, the Taconic experienced more than 2,000 crashes, with the majority occurring in Westchester County.
Wrong-way driving represents a particular problem on the Taconic, frequently involving alcohol use. The combination of confusing entrance configurations, inadequate signage, and impaired drivers creates situations where vehicles enter the parkway traveling in the wrong direction, leading to head-on collisions that are almost always catastrophic.
Other dangerous roads in Westchester County include:
- State Route 9A, which spans 47 miles between Manhattan and Peekskill and experiences high traffic congestion and resultant accidents.
- The Saw Mill River Parkway, running almost 30 miles through Westchester County, sees frequent crashes due to its proximity to other major roads and the dangerous intersections that result.
Long Island presents a distinct injury pattern characterized by higher speeds, wider roads, and a mix of suburban parkways and rural stretches. Suffolk County consistently ranks as one of the deadliest counties in New York State for traffic accidents. The combination of rural backroads where drivers travel at high speeds and congested arterials creates what safety researchers describe as a deadly mix.
Nassau County contributes substantially to Long Island injury counts, with the Southern State Parkway and Long Island Expressway generating massive volumes of rear-end collisions and multi-vehicle pile-ups during rush hours. Recent trends have included a troubling rise in wrong-way driving incidents and alcohol-involved crashes in 2023 and 2024.
The geographic distinction between New York City and Long Island injury patterns reflects fundamental differences in how crashes occur and who gets hurt. Long Island crashes more frequently involve high speeds and severe impacts between vehicles. New York City crashes more often occur in lower-speed environments but involve pedestrians, cyclists, and other vulnerable road users who lack the protection of a vehicle.
Who Is Most Likely to Be Seriously Injured in New York Traffic Crashes?
Pedestrians accounted for 112 of the 206 traffic deaths, representing 54 percent of all fatalities. In an urban state where millions of people walk as part of their daily routine, people on foot face the greatest risk of being killed in traffic.
Eighty-nine percent of pedestrian deaths in 2025 happened on streets eligible for Sammy’s Law, which empowers New York City to lower speed limits from 25 miles per hour to 20 miles per hour. Yet the prior administration had applied this power to only a tiny percentage of eligible streets. That means the vast majority of pedestrian deaths occurred in locations where a proven safety measure could have been implemented but was not.
The pedestrian injury pattern is not distributed evenly across the city. Brooklyn saw a particularly tragic concentration of child pedestrian deaths in 2025. Two eight-year-olds and one five-year-old were all killed while crossing streets. These deaths represent more than statistics. They reflect specific locations where infrastructure failed to protect the most vulnerable road users.
Certain neighborhoods see disproportionate numbers of pedestrian crashes. Areas with high pedestrian density but inadequate crossing infrastructure, poorly timed traffic signals, or streets designed to prioritize vehicle speed over pedestrian safety consistently generate more injuries. Immigrant communities and lower-income neighborhoods often fall into this category, experiencing both higher pedestrian traffic due to lower car ownership rates and less investment in pedestrian safety infrastructure.
Motorists, who accounted for 73 deaths in 2025, experienced a thirty-two percent reduction in fatalities compared to 2024. That translates to 34 motorist lives saved in a single year. This substantial improvement likely reflects both improved vehicle safety features and infrastructure improvements that have made roads more forgiving of driver error.
The geographic distribution of motorist injuries shows Long Island’s particular vulnerability. Higher speeds on parkways and arterial roads generate more severe crashes despite lower traffic volume compared to New York City. Rear-end collisions represent the most common crash type, particularly on Long Island’s parkways during rush hour. Side-impact or T-bone collisions, though less common overall, represent the most dangerous crash type and frequently occur at intersections where drivers attempt to beat traffic lights.
Cyclists accounted for 21 deaths in 2025, a figure that remained consistent with the Vision Zero era average but represented three fewer deaths than 2024 and ten fewer than 2023. However, this overall improvement masks concerning geographic variation. Brooklyn achieved massive cyclist safety improvements, declining from an average of eight cyclist fatalities to just one in 2025. That dramatic reduction demonstrates that targeted safety investments, particularly protected bike lanes, can substantially reduce cyclist injuries and deaths.
Conversely, cyclist fatalities in Queens more than doubled, increasing from four to nine. Deaths also rose in Manhattan. The uneven progress across boroughs indicates that improvements in cyclist safety have not been distributed equally and that certain areas remain particularly dangerous for people riding bicycles.
The growth in e-bike usage has contributed to increased cyclist injuries and fatalities. The rapidly expanding fleet of electric bikes has increased both the number of cyclists on roads and the speeds at which they travel, potentially increasing injury severity in collisions. In 2024, New York City recorded 24 cyclist fatalities, with riders constituting 10 percent of all traffic crash victims and more than 5,000 bicyclists injured in accidents that year.
What Factors Make Certain Areas More Dangerous Than Others?
Infrastructure design stands out as perhaps the most significant determinant of where crashes occur and how severe they become.
Wide, straight roads with multiple lanes encourage higher speeds. When pedestrians attempt to cross these roads, they face longer exposure times in traffic and vehicles approaching at speeds that make stopping difficult. Intersections with poor sight lines, confusing lane configurations, or inadequate signal timing create situations where crashes become more likely. Roads lacking protected bike lanes force cyclists to share space with fast-moving vehicle traffic, dramatically increasing their vulnerability.
The presence or absence of proven safety measures directly determines injury rates. Speed cameras reduce crashes in the corridors where they operate. Protected bike lanes reduce cyclist injuries by creating physical separation between bicycles and motor vehicles. Leading pedestrian intervals, which give pedestrians a head start when crossing intersections, reduce conflicts between turning vehicles and people on foot. Raised crosswalks and curb extensions increase pedestrian visibility and reduce crossing distances.
Areas that have received these safety improvements have seen measurable declines in injuries. Areas that have not received these improvements, or where proposed safety projects have been delayed or abandoned, continue to see injuries accumulate. The geographic distribution of injuries therefore reflects not just inherent characteristics of different areas but also the distribution of safety investments and political will to implement proven countermeasures.
Traffic volume and speed interact with infrastructure design to determine risk. High-volume roads are not necessarily the most dangerous if they include appropriate safety infrastructure. Conversely, lower-volume roads can be extremely dangerous if they encourage high speeds and lack safety features. The Taconic State Parkway exemplifies this pattern, with moderate traffic volume compared to urban highways but extremely high crash severity due to high speeds and unforgiving design.
Driver behavior patterns also contribute to geographic injury concentrations. Areas with high rates of speeding, red light running, failure to yield to pedestrians, and distracted or impaired driving see more crashes. These behavioral patterns often reflect enforcement priorities and the perceived likelihood of consequences for dangerous driving. Neighborhoods where traffic enforcement is minimal tend to see more dangerous driving behavior and correspondingly higher crash rates.
How Have Safety Improvements Changed Injury Patterns?
The dramatic improvements in some boroughs while others stagnated or worsened demonstrates that injury patterns are not fixed or inevitable. The Bronx’s 38 percent decline in traffic fatalities represents the success of coordinated safety interventions implemented systematically across the borough.
The installation of 24/7 speed safety cameras has contributed significantly to injury reductions in areas where they operate. Unlike cameras that only operate during certain hours, 24/7 cameras provide consistent speed enforcement that changes driver behavior. The data shows that in corridors with 24/7 speed cameras, speeds decline and crashes decrease.
Street redesign projects that have been completed show measurable results. Fourth Avenue in Brooklyn, where a comprehensive safety redesign was installed, saw pedestrian injuries drop by 29 percent. That improvement reflects the effectiveness of measures including protected bike lanes, lane reductions that calm traffic, improved crosswalks, and better signal timing.
Brooklyn’s dramatic reduction in cyclist fatalities from an average of eight to just one in 2025 reflects the expansion of protected bike lanes and other cyclist safety infrastructure. Protected bike lanes create physical separation between bicycles and motor vehicles, eliminating the most common and most severe crash types involving cyclists.
The improvements in motorist fatality rates, with a thirty-two percent reduction saving 34 lives in 2025, reflect both improved vehicle safety technology and infrastructure improvements that make roads more forgiving. Rumble strips, better signage, improved road surface conditions, and intersection redesigns all contribute to reducing motorist injuries.
However, the uneven distribution of these improvements has created a patchwork of safety across New York. Neighborhoods that have received comprehensive safety investments have seen dramatic improvements. Neighborhoods still waiting for promised improvements continue to see injuries accumulate. Third Avenue in Brooklyn and Fordham Road in the Bronx stand as clear examples of how delayed safety projects translate directly into preventable injuries and deaths.
What Do These Patterns Mean for Injury Claims?
When crashes occur at intersections or along corridors with documented safety problems, that history becomes relevant to understanding how and why the crash occurred. An intersection like Northern Boulevard at 48th Street, which has seen nine people killed or seriously injured between 2022 and 2025, represents a known hazard. The fact that this danger has been documented but not adequately addressed may be relevant to claims arising from crashes at that location.
Similarly, crashes on corridors where safety improvements were proposed but not implemented, like Third Avenue in Brooklyn or Fordham Road in the Bronx, occur in a context where the danger was known and solutions were available but not deployed. This context does not automatically determine liability in any individual case, but it provides important background for understanding the circumstances that contributed to the crash.
The data on speed as a factor in crash severity supports injury claims in cases where speeding contributed to the crash or increased injury severity. The fact that 89 percent of pedestrian deaths in 2025 occurred on streets eligible for Sammy’s Law speed reductions demonstrates the connection between speed and pedestrian injury severity. In cases where speed contributed to a crash, this broader context supports claims about the role of speed in causing or aggravating injuries.
For cyclists injured in areas without protected bike lanes, the data showing dramatic injury reductions in areas with protected lanes provides context for understanding how infrastructure deficiencies contributed to the dangerous conditions that led to the crash. While the absence of a bike lane does not automatically establish liability, it forms part of the overall picture of the conditions that contributed to the crash.
The documentation of dangerous intersections and corridors also matters for understanding whether victims could have reasonably anticipated and avoided the danger. When crashes occur at locations with documented, long-standing safety problems, arguing that victims should have known to avoid the area becomes less persuasive. These are often major streets that people must use to reach work, school, or home.
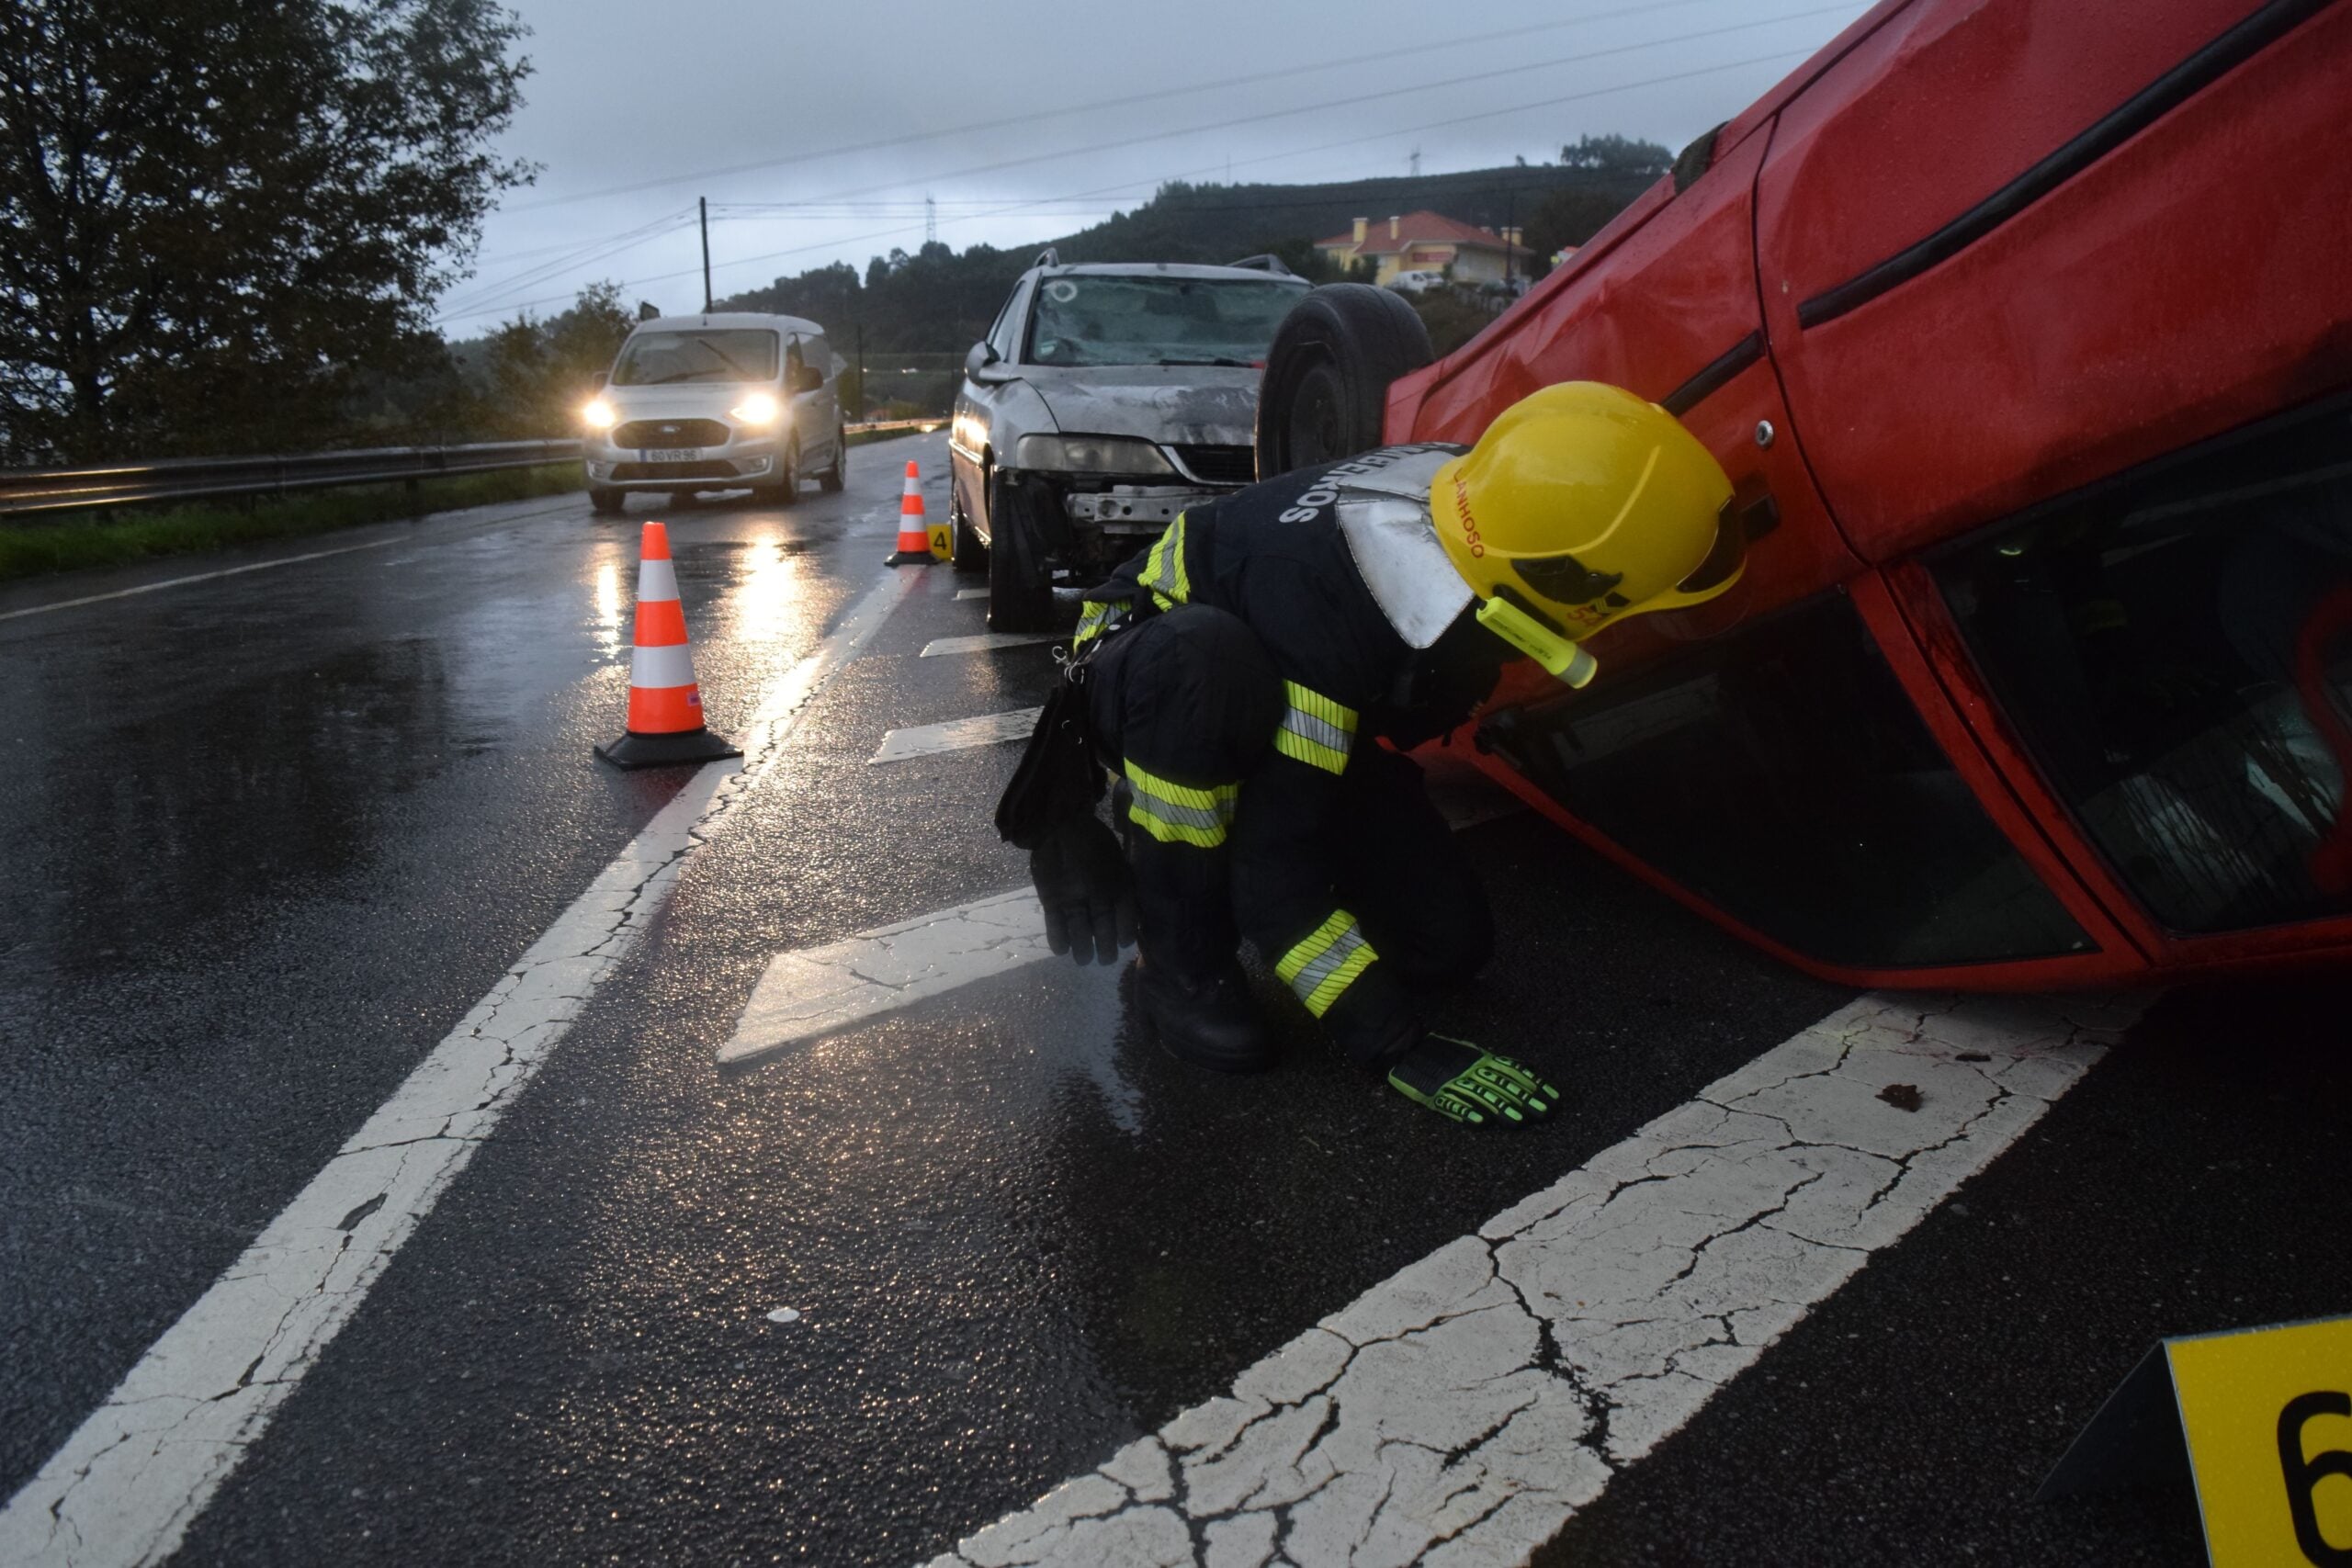
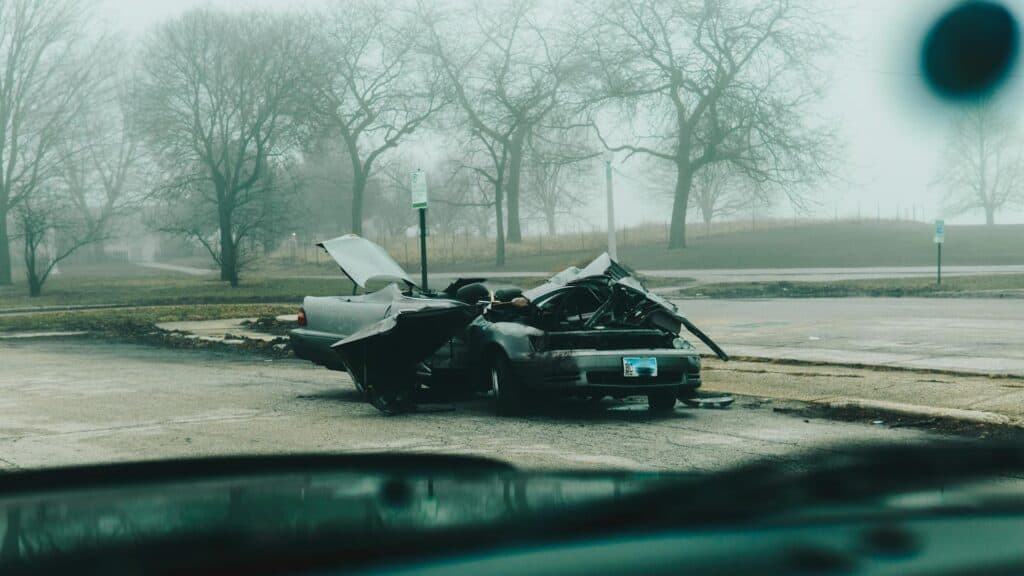
What Should You Do If You Are Injured in a Car Accident?
If you are physically able, move to a safe location away from traffic. Call 911 to report the accident and request medical assistance if anyone is injured.
Even if you do not believe you are seriously injured, get evaluated by a medical professional as soon as possible. Some injuries, particularly internal injuries, traumatic brain injuries, and soft tissue injuries, may not produce immediate symptoms but can be serious. Delaying medical treatment can both harm your health and create complications for any insurance claim or lawsuit.
Document the accident scene if you are able to do so safely. Take photographs of vehicle damage, the position of vehicles, traffic signals and signs, road conditions, and any visible injuries. Get contact information from witnesses. Note the exact location, time, and weather conditions.
Exchange information with other drivers involved, including names, contact information, insurance information, and vehicle registration information. Do not discuss fault or apologize, as these statements can be used against you later. Stick to factual information when speaking with other drivers or police.
Report the accident to your insurance company, but be cautious about giving recorded statements or signing releases before consulting with an attorney. Insurance adjusters may try to get you to make statements that minimize your injuries or suggest you were at fault.
Keep detailed records of all medical treatment, including emergency room visits, follow-up appointments, physical therapy, prescriptions, and any medical equipment or modifications needed due to your injuries. Save all receipts and bills related to the accident, including medical expenses, vehicle repair or replacement costs, and expenses for transportation to medical appointments.
Document how the injuries affect your daily life, including time missed from work, activities you can no longer perform, pain levels, and emotional impacts. This documentation becomes important when seeking compensation for pain and suffering and loss of quality of life.
Consult with a personal injury attorney who has experience with car accident cases in New York. Many personal injury attorneys offer free consultations and work on a contingency basis, meaning they only get paid if you recover compensation. An experienced attorney can evaluate your case, explain your legal options, deal with insurance companies on your behalf, and ensure you do not accept a settlement that fails to adequately compensate you for your injuries.
Talk to our experienced personal injury lawyers and know all your legal options for recovery in a free, no-obligation consultation.
Summing It Up
New York achieved historic progress in traffic safety during 2025, with fatalities dropping to levels not seen in over a century. But that achievement coexists with a troubling reality. Four New Yorkers still died in traffic crashes every week on average. Thousands more suffered serious injuries. And those injuries and deaths concentrated in specific, identifiable locations where infrastructure deficiencies, delayed safety improvements, and inadequate enforcement created persistently dangerous conditions.
The geographic patterns revealed in the 2025 data demonstrate that traffic injuries are not randomly distributed or inevitable. Northern Boulevard at 48th Street in Queens, Third Avenue in Brooklyn, Fordham Road in the Bronx, the Taconic State Parkway in Westchester, and numerous other specific locations account for disproportionate numbers of serious injuries and deaths. These concentrations reflect infrastructure design, the presence or absence of proven safety measures, and decisions about where to invest in improvements.
The uneven progress across boroughs shows that dramatic improvements are possible when safety measures are implemented systematically. The Bronx’s 38 percent decline in traffic fatalities and Brooklyn’s reduction in cyclist deaths from eight to one demonstrate that coordinated safety interventions work. Conversely, the continued accumulation of injuries on corridors where proposed safety improvements have been stalled or abandoned demonstrates the human cost of delayed action.
For pedestrians, who accounted for more than half of traffic deaths in 2025, the concentration of fatalities on streets eligible for Sammy’s Law speed reductions highlights a clear opportunity for preventing injuries. For cyclists, the dramatic differences in safety outcomes between boroughs with protected bike lanes and those without demonstrates the effectiveness of separated infrastructure. For motorists, the significant reduction in fatalities reflects both improved vehicle safety and infrastructure improvements that make roads more forgiving.
If you have been injured in a car accident in New York, understanding these geographic patterns and infrastructure factors provides important context for your situation. The location where your crash occurred, the infrastructure conditions present, and any documented history of crashes at that location all form part of the picture of what happened and why. Consulting with an experienced personal injury attorney can help you understand how these factors apply to your specific case and what legal options you have for seeking compensation for your injuries.
If you believe you may have a claim, the Porter Law Group is available to evaluate your situation and walk you through your options. Reach out to us today. Fill out our online form for a free consultation and know your options. You can also call 833-PORTER9 or email info@porterlawteam.com to get started.